Engineers love playing with numbers, equations, and graph paper. They like playing with lines, French curves, straightedges, and their triangles. From all of their frivolous number-crunching and sketching, sometimes they come up with specific useful information.
They, the engineers, discuss interesting ideas on how to squeak even more performance out of their curves. They will ask, “What if” many times; they will theorize and hypothesize, and they will also ask, “Could we …” or “Is it possible…”
A pilot, on the other hand, simply asks, “So, what power setting will give me 130 knots?”
Math and physics have overburdened most engineers’ minds while pilots typically have a firm grasp on simplicity. It is just the way the different minds of pilots and engineers work.
The real questions important for pilots to know, ask, and understand are, “How far will this puppy fly?” and “Just how long will this thing stay up here?”
Both questions are dependent on one’s understanding of the engineer’s performance plots and curves.
Maximum range and maximum endurance are two completely different concepts. While maximum endurance deals with keeping an airplane airborne as long as possible, it is not the speed or power setting that enables the plane to fly the greatest distance. That power setting and speed will be higher.
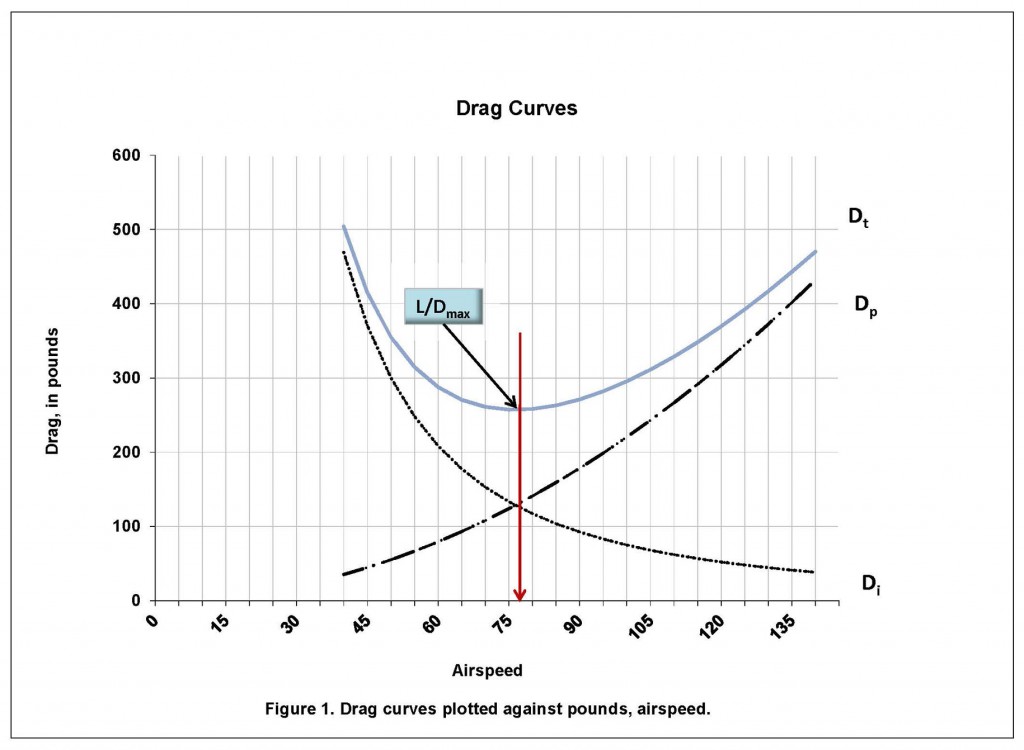
Max endurance is the speed at which the engine does the least amount of work keeping the airplane in the air. This occurs at the point where total drag is the least. In Figure 1., you will find the drag curves plotted in pounds on the vertical axis versus speed on the horizontal axis. Here, the three curves represented are induced drag, parasitic drag, and total drag. Keep in mind the equation: Di + Dp = Dt.
On the plot, Di is greater at lower airspeeds increased by the drag created by lift. While Dp, on the other hand, increases the faster the airplane flies. The sum of the two create a curve which forms a large “U.” It is at the bottom, lowest point on the “U,” where you will find L/Dmax.
This is the speed used when the engine quits because it is where drag is the least, giving the greatest gliding distance for altitude. Flying with power at this airspeed requires minimal work from the engine, resulting in the lowest fuel flow. For this, the reward for the pilot is the longest time airborne on a tank of gas.
Optimum cruise speed for an airplane is determined by drawing a straight line from the origin to the point at which it touches the bottom of the total drag curve. Keep in mind, this is the optimum cruise speed, not the maximum range speed.
To take the airplane the farthest distance on a tank of gas is a slightly different situation—and airspeeds derived from a different chart. Yes, airspeeds, as in multiple, rather than singular. The correct speed to fly for maximum range depends on the headwind component.
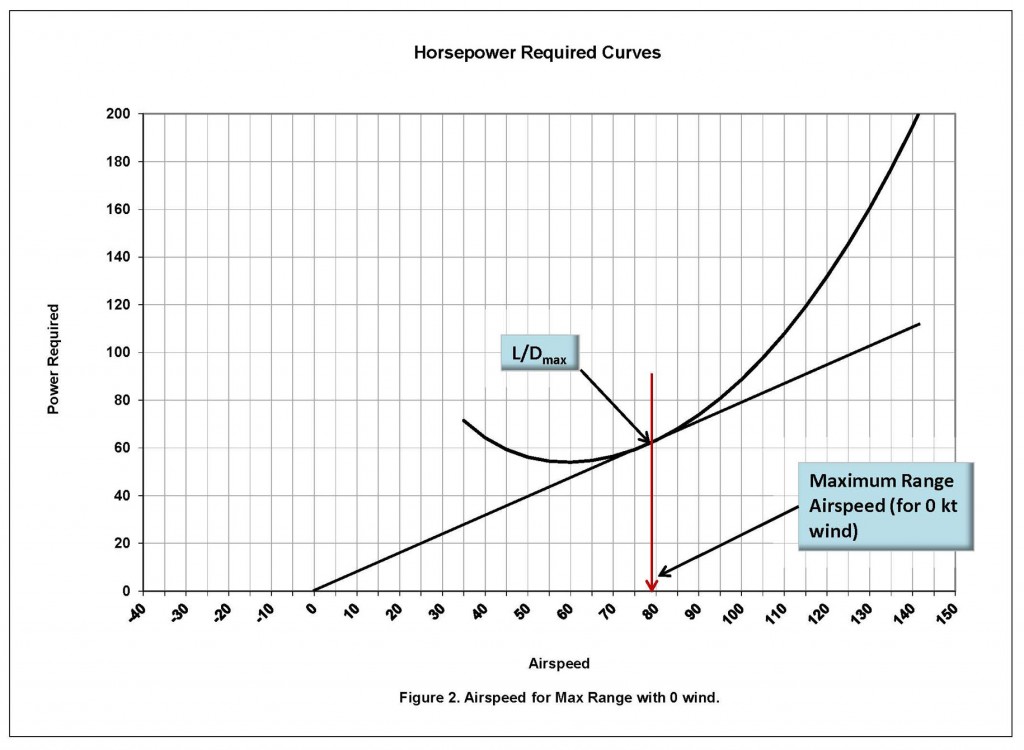
The question now becomes—how can you determine the best speed to fly for maximum range? Unfortunately, the manufacturer’s Pilot Operating Handbook (POH) and Pilot Information Manual (PIM) lack adequate information regarding best range selection. In fact, the manufacturers do not publish the maximum range information in any of their manuals. This is probably an attempt to protect themselves from lawsuits stemming from pilots trying to stretch the range farther than they should. If you find an engineer and ask him to draw the graphs, you can determine the answer, which is on the curve created by the power required curve and the point at which a straight line from the origin touches the bottom of the curve (see Figure 2.)
As indicated in Figure 2., the maximum range speed corresponds with L/Dmax representing flight in a no-wind condition. The next consideration becomes, how often do pilots fly in a “no-wind” air mass? This leads to the question of how to adjust the speed to accommodate the headwind or tailwind.
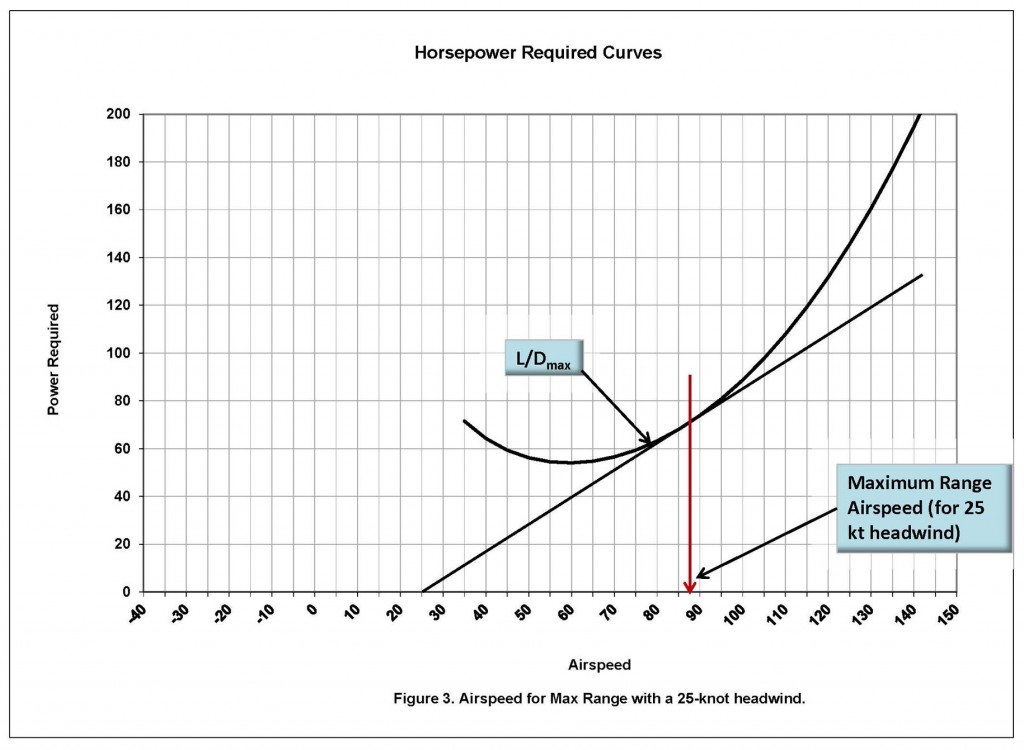
If there is a 25-knot headwind, the line that began at the origin now must be adjusted 25 knots to the right (+25). Redrawing the line from this point touches the power required curve at a point corresponding to a higher airspeed (see Figure 3.)
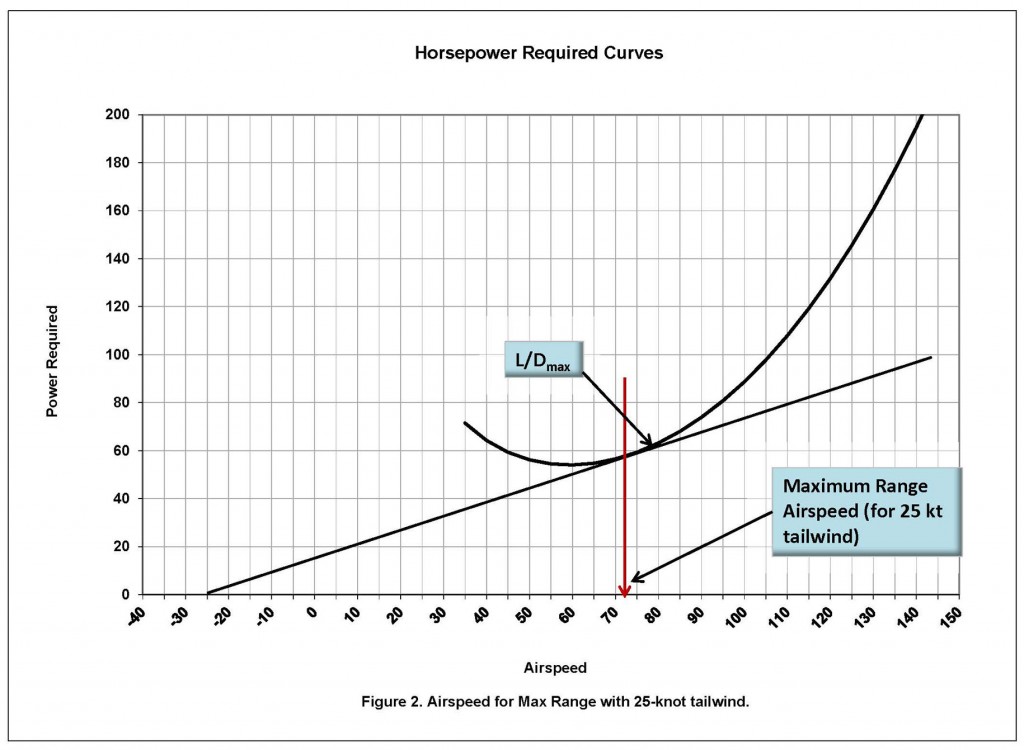
On the other hand, if you have a minus 25 knot headwind (yes, this is actually the correct terminology and of course, we as pilots refer these winds as tailwinds), the line connecting the power required curve is moved 25 knots to the left of the origin (-25) as in Figure 4.
Setting the power to fly at these points will maximize fuel mileage. There is also corollary knowledge that goes along with flying at these speeds. Typically, when the winds at altitude are in excess of 20 knots or so, there is usually less wind at lower altitudes. The important concept here is: smart pilots stay in the tailwind as much as possible and minimize their exposure to headwinds.
In other words, it is advantageous to get up to altitude as quickly as possible to stay in the tailwind longer and for the headwind, pilots should take their time in climbing to shorten the time spent fighting the headwind. Translated, this means use a Vy climb to altitude for the tailwind and use a cruise climb to fly against a headwind. Additionally, thinking pilots fly tailwinds at higher altitudes and fly lower into headwinds where the wind is not as severe.
It is all in the flight planning and sometimes, a pilot may have to run several iterations of the cross-country plan to find the best combination of altitude, groundspeed, and power setting. Modern day aviators can do this more easily and automatically with a new IPad-2 and ForeFlight. For flight instructors, however attractive the new technology of hardware and software, keep in mind you still have to be proficient with the old ways.
In addition, you must also teach your students the foundational skills of using flight manual, charts, pencils, plotters, and whiz-wheels.
-30-
©2011 J. Clark
Note: Email subscribers, please go to my blog to view vids


ty for the this topic