When I learned how to fly in 1971, I was a kid who really did not know much about anything, but thought I knew everything. When it came to airplanes and flying, I knew even less than I realized. When I was flying one of Charlie’s Cubs in the summertime and the airplane took a sudden jolt from an afternoon thermal, occasionally I would think one of the wings or the tail might fall off.
Again, because I was uneducated and ignorant, I knew far less than I needed to know. One of the things I needed to know but knew nothing about was “the envelope.”
Aviators know the envelope better as the Vgn or the Vg-Vn diagram. Knowing about this diagram can put a pilot’s mind at ease when the airplane starts bouncing around in the late afternoon summer skies.
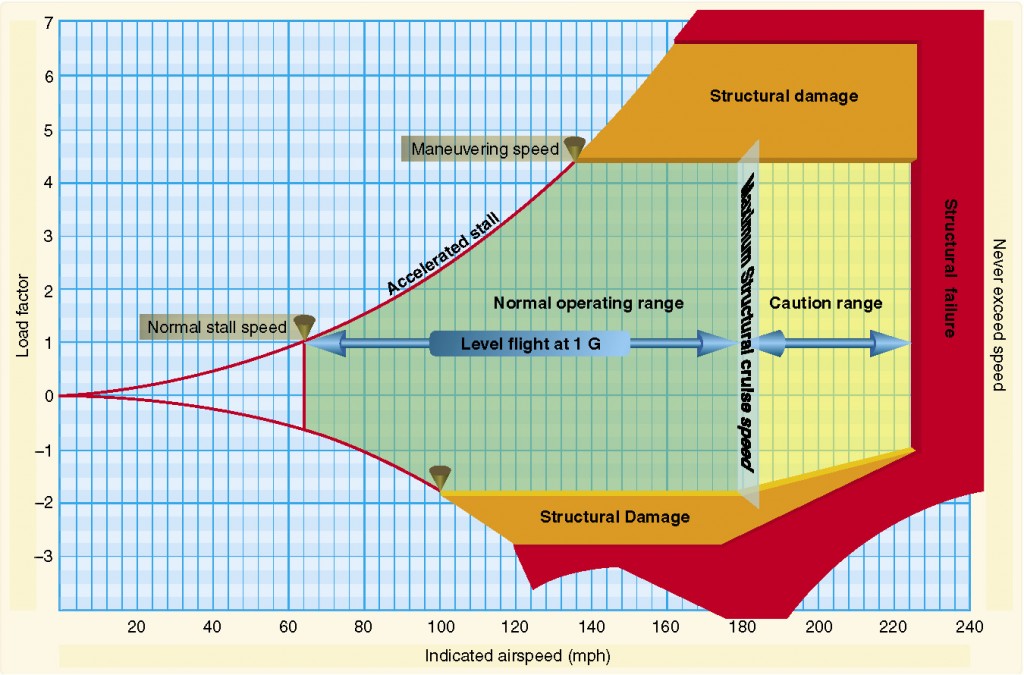
This example of a Vgn diagram shows an airplane in the utility category. Load factors determine the category of operation; for normal operations, the maximum g-load is +3.8g and -1.52g. For utility operations, the numbers are +4.4g and -1.76g. For acrobatic aircraft, the maximum permissible positive loads are +6g’s and -3g’s. Here is another practical bit of knowledge—most human beings become uncomfortable at loads over 2g’s. This is what tends to keep us operating in “the heart” of the envelope, or right in the middle of the green area.
On the Vgn diagram, the horizontal axis depicts speed while the vertical shows G, or load factor. The generic Vgn diagram above shows the numbers for a relatively heavy and fast airplane. As depicted from this chart, normal cruising speed is near 180 mph, Vne is just over 224 mph, and stall speed is 64 mph.
To determine the stall speed as 64, you enter the chart on the vertical axis at the 1g line. Moving across until the 1g line intersects the accelerated stall speed curve gives you the stall speed of the aircraft in a wings level attitude at 1g.
In maneuvering flight, a pilot flying the airplane in a 60-degree angle of bank turn would have a load factor of 2g’s. Similarly, as for the 1g stall speed, enter the chart at the 2g line on the vertical axis and go across until you reach the accelerated stall curve. This gives you a stalling speed of 92 mph.
The important thing about the accelerated stall curve is this: below the speed of 136 mph (Va), the wing will stall before doing damage to the aircraft. In this example, the illustrated envelope shows the numbers for an aircraft flying in the utility category.
At speeds less than 136 mph, moving up the chart along increased g-loads, the pilot’s pencil point will cross into the clear space before going through the orange “Structural Damage” area of the chart. In this orange area, at speeds greater than 136 mph, a pilot can damage the airframe.
This damage may not be obvious to the eye, but has in fact, occurred. The ugly thing about damage of this sort is that it decreases, or shrinks, the available range on the Vgn diagram. This is similar to the idea of taking some of your mother’s favorite silverware and bending it back and forth. You can do this for so long before the utensil breaks. It is the same with the aircraft structure.
At speeds above 162 mph, the damage goes beyond structural and into the realm of actual failure. Flying anywhere into the red on the chart is—well—bad. It could actually result in the airplane coming apart in-flight. This is something you do not want to experience while sitting in the airplane.
As mentioned, most of us are comfortable up to 2g’s. Stay inside the green and life is good.
-30-
©2011 J. Clark
Note: please go to my blog to view vids and photos Subscribe by email


Pingback: More on G and the Envelope | joeclarksblog.com
Pingback: Airplane stall speeds | Firewavedesign